Navia Monthly Market Spotlights- January 2024

As January unfolds, the stock markets keenly observe the reverberations of Ayodhya’s spiritual renaissance and the anticipation surrounding the 2024 budget. With the Ram Mandir pran-pratishtha on the horizon, Ayodhya is poised to become a global spiritual hub, attracting economic and religious migrations. A substantial government investment of Rs 1,800 crore is expected to fuel growth across various sectors, from hospitality to cement. Investors navigate the intricate landscape, cognizant that government budget decisions will significantly shape market dynamics in the coming months. In this blog series, we dissect the intertwining narratives of spirituality, economics, and market fluctuations in the wake of Ayodhya’s transformative journey.
Indian Market Performance
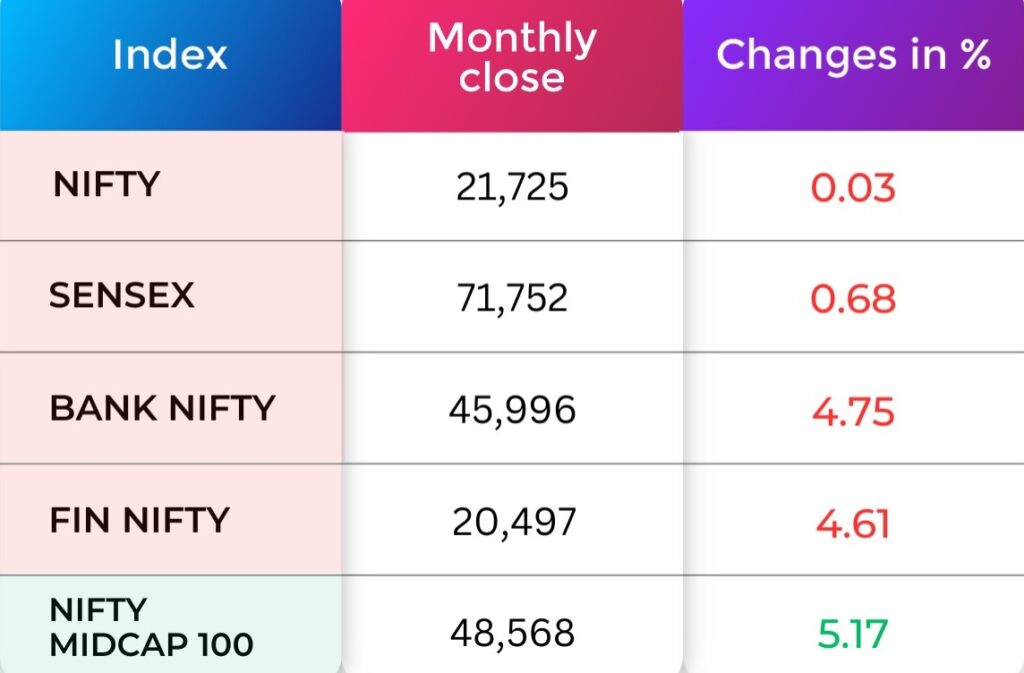
During the month, the BSE Sensex decreased by 0.68 percent, concluding at 71,752. while the Nifty50 saw a loss of 0.03 percent, closing at 21,725.
For any further queries, you can now reach out to us on Whatsapp!
Indices Analysis
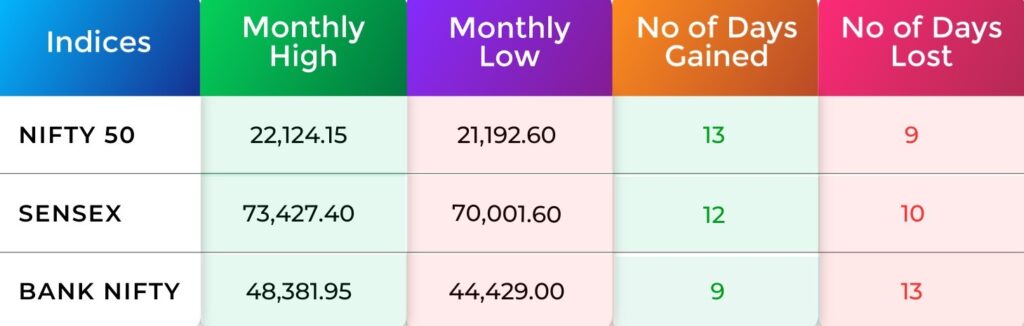
Sensex and Nifty reached new record peaks of 73,427.40 and 22,124.15, respectively
NIFTY 50
NIFTY 50 experienced a correction in the first week, finding support around 21,500. Positive momentum was expected, signaled by the hourly indicator. The second week featured a significant consolidation breakout, driven by strong performances in technology stocks. Confidence grew as the index approached 22,000, with key support at 21,600-21,500. The latter part of the month saw volatile price action with resistance at 21,520–21,550 and support at 21,240–21,220, leading to consolidation. The final week recorded a 2.35 percent gain but hinted at a potential bearish reversal. The key hurdle for an upward movement remained at 22,150, while a break below support at 21,500 could indicate a bearish momentum. Monitoring decisive breakout points remains crucial in the evolving market scenario.
BANK NIFTY
Bank Nifty showed mixed performance. The first week featured volatility, recovering over 300 points, with an emphasis on closing above 48,200 for further gains. The second week marked a reversal to an upward trend, targeting 48,000 and potentially extending to 48,500. Weekly charts suggested consolidation with support at 46,900-47,000. The third week highlighted the need to surpass 46,300 for upside potential, while a close below 45,600 could trigger a downside correction. The final week opened higher, reaching 46,892, but profit-taking led to a 218-point decline. Gaining 2.5 percent for the week, the Bank Nifty formed a bullish candlestick, facing 47,000 as the next hurdle. The month showcased a blend of volatility, recovery, and resistance, influenced by market dynamics and profit-taking strategies.
Sector Performance
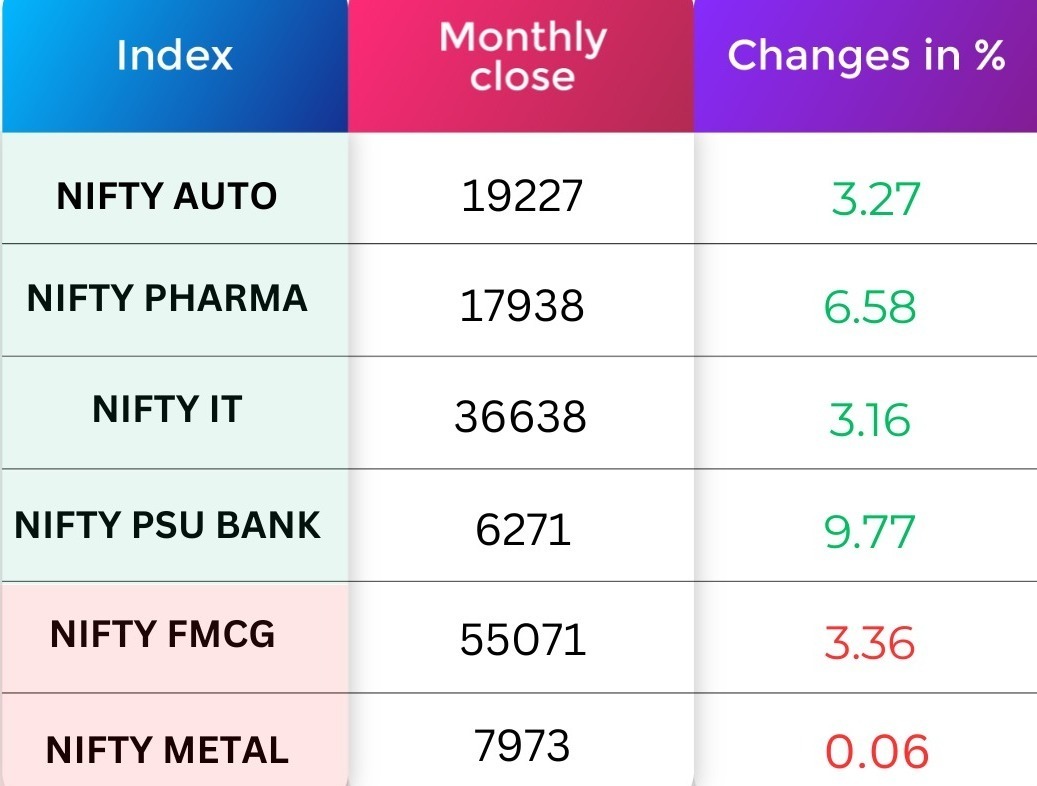
Over the past few months, domestic indices experienced a strong rally, reaching unprecedented highs, and an overarching sense of optimism permeated various sectors. The Nifty Pharma index, serving as a sectoral indicator for the pharmaceutical industry, demonstrated remarkable resilience.
Significant foreign investments in the sector, combined with stellar performances by pharmaceutical companies, have played a pivotal role in driving the robust upswing. Additionally, the Indian pharmaceutical industry is undergoing a substantial transformation propelled by technological advancements that have previously revolutionized the IT industry.
Nifty Chart
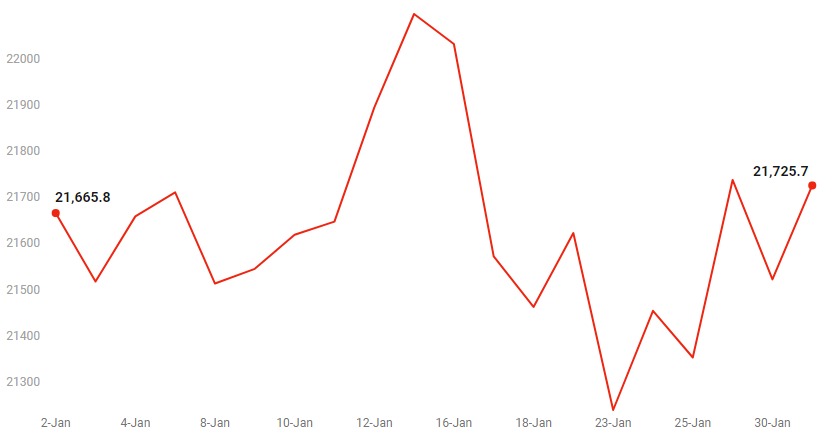
In January 2024, Nifty showed potential for a climb towards 21800-21850 and beyond 22000 if surpassing 21850, with a short-term support around 21500. The second week marked a new closing high of 21,895, indicating strong buying interest. Despite volatility, the third week remained within the 21500-21700 range, awaiting a breakout for directional movement. Towards month-end, indicators suggested continued consolidation, with support at 21660-21600 and a hurdle zone at 22100-22150, emphasizing stock-specific actions and sector rotation.
Volatility Index
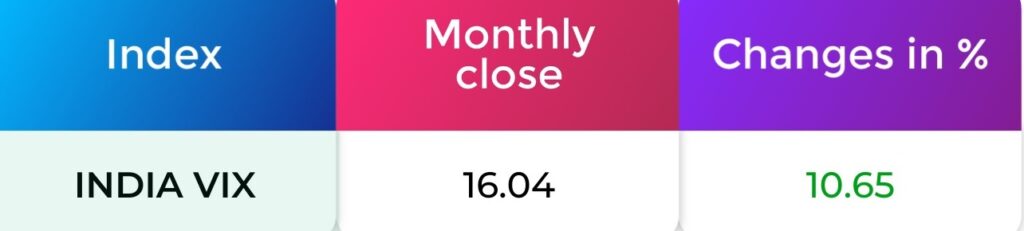
The monthly closure of India VIX is recorded at 16.04, reflecting a percentage change of +10.65. This indicates an upswing in market volatility, as a positive change in the VIX points to heightened expectations for increased market volatility.

FII & DII Activity
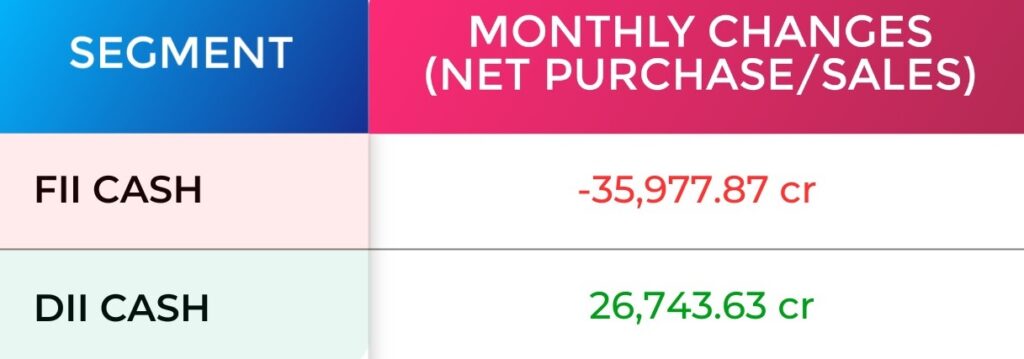
For the month Foreign institutional investors (FIIs) sold equities worth Rs 35.977.87 crore, while Domestic institutional investors (DIIs) bought equities worth Rs 26,743.63. crore.
Refer your Friends & Family and GET 500 N Coins.
Use N Coins to Redeem all Charges. #Trade4Free.
Global Market
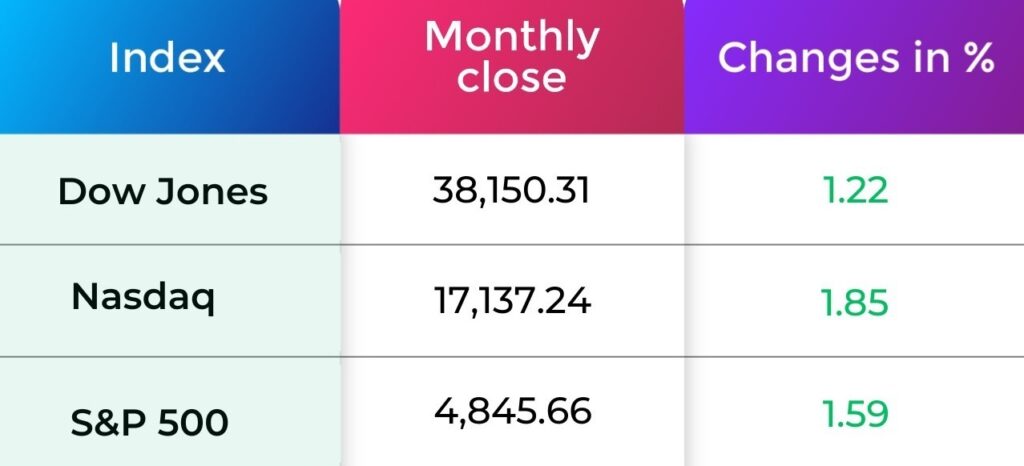
The Dow Jones Industrial Average rose 1.22%, the S&P 500 advanced 1.59%, and the NASDAQ added 1.85%. Large-caps fared better than Small-caps in January–the Russell 1000 index increased 1.4%, while the Russell 2000 dropped 3.9%. Growth outperformed value within both indices.
Currency Indices
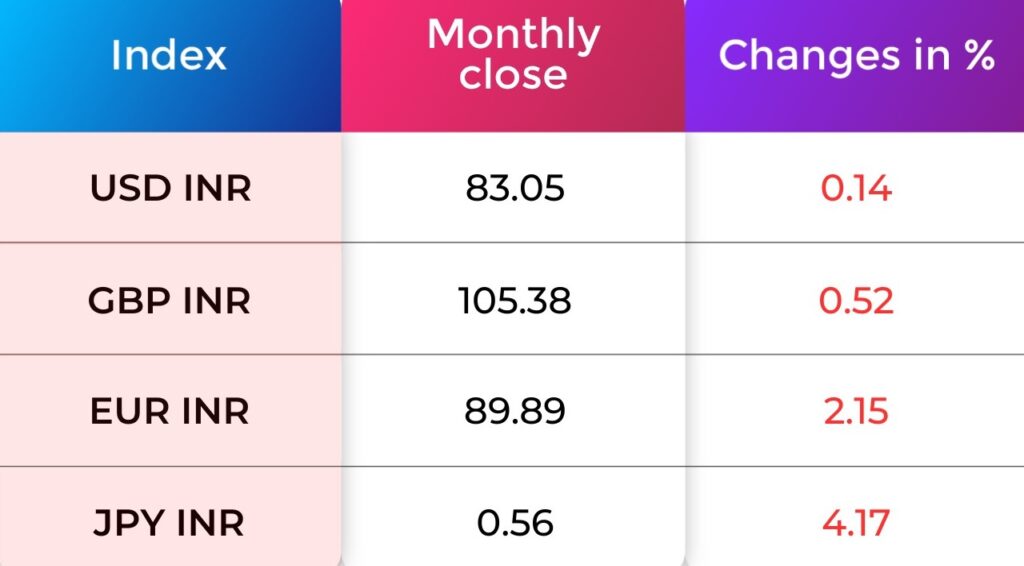
The Indian rupee experienced slight improvements against the US dollar, concluding the month at 83.05 compared to the closing rate of 83.17 on December 29.
Commodity Market
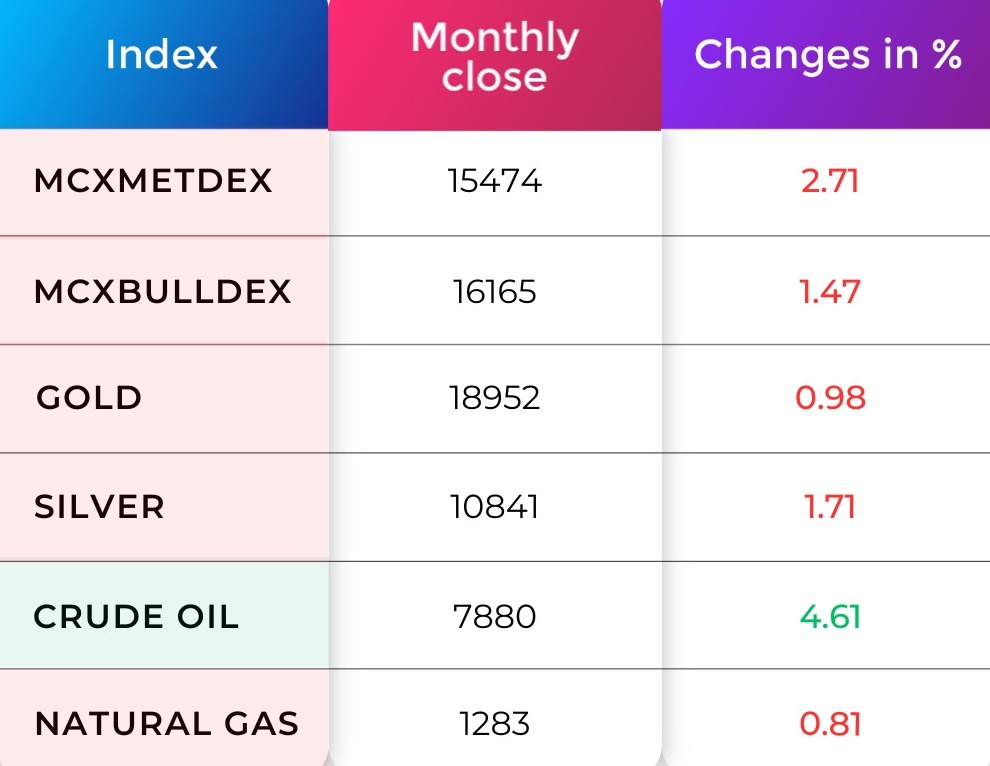
In January, the price of Gold declined by 0.98%. Crude oil prices rose, marking a 4.61% increase. Despite higher oil prices, the average gas price dropped by 0.81% in January,
IPO Corner

Featured Blogs of the Month

Refer your Friends & Family and GET 500 N Coins.
Use N Coins to Redeem all Charges. #Trade4Free.
Do you have a question? Ask here and we’ll publish the information in the coming weeks.

Do You Find This Interesting?

Happy Learning,