Weekly Wrap-Up (JAN 23 – JAN 25, 2024)

During the shortened week ending on January 25, the Indian stock market sustained declines due to a combination of factors, including varied corporate earnings in India, potential postponement of the US Federal Reserve rate cut, tensions in the Middle East, and ongoing selling by foreign institutional investors.
Indices Weekly Performance
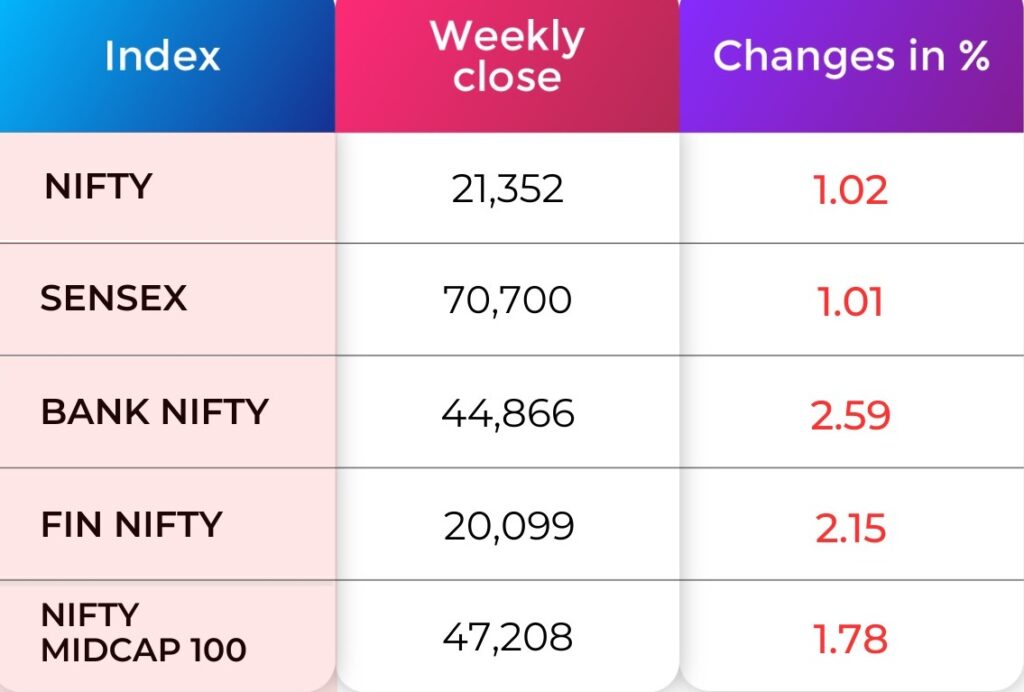
Over the week, the BSE Sensex decreased by 1.01 percent, concluding at 70,700, while the Nifty50 fell by 1.02 percent, finishing at 21,352.
For any further queries, you can now contact us on WhatsApp!
Indices Analysis
NIFTY 50
On Thursday, the Nifty opened on a flat note and witnessed volatile price action. It closed down ~90 points. On the daily charts, we can observe that the counter-trend rally faced resistance at the zone of 21,520–21,550. On the downside, the 21,240–21,220 zone acted as a support zone where the 40-day moving average is placed. Thus, the Nifty is consolidating within these two parameters. A breach of this range shall lead to a move in that direction. The hourly momentum indicator has a positive crossover which is a buy signal and hence there can be a minor degree bounce up to 21,520–21,550 before it resumes the next leg of the fall.
BANK NIFTY
Bank Nifty has witnessed a sharp pullback from intraday lows though closed marginally in the red. On the hourly charts, we can observe that there is a positive divergence and a positive crossover which indicates a loss of momentum on the downside and indicates that there can be a relief rally going ahead till 45,500- 45,700. On the downside, 44,600–44,500 is the crucial support zone.
Nifty Chart
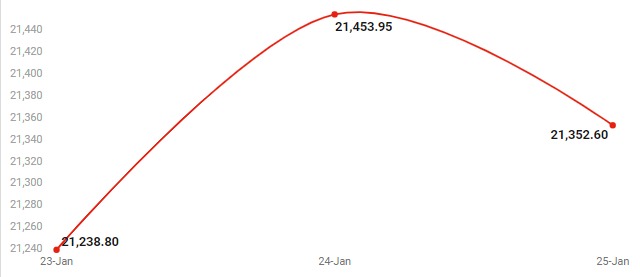
From a technical perspective, we anticipate a downward movement in the market, with the initial resistance noted at the 21,400 level. The expectation is for the market to decline further towards 21,100 and eventually 21,000. Should the 21,000 level be breached, we may observe increased selling pressure, potentially leading to levels between 20,900 and 20,500. A shift in the trend is likely to occur only if the Nifty surpasses the 21,500 mark.
Now with N Coins, Navia customers can actually #Trade4Free.
INDIA VIX
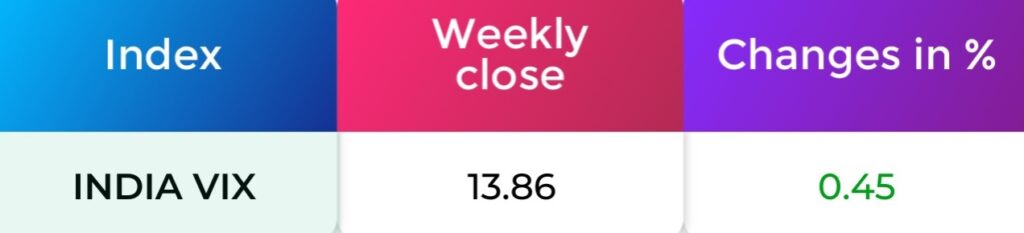
The drop of 0.45 points in India VIX to 13.86 suggests a moderate Increase in market volatility.
Refer your Friends and family and GET 500 N Coins.
Use N Coins to Redeem all Charges. #Trade4Free.
Sectoral Performance
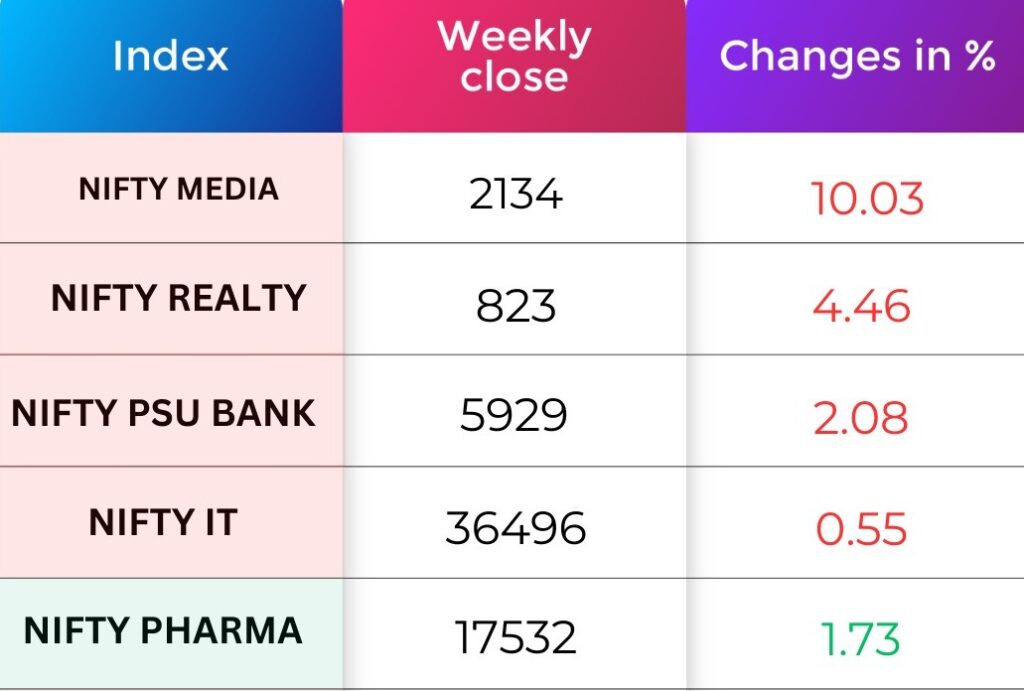
On the sectoral front, Nifty Media index shed 10.03 percent, Nifty Realty index down 4.46 percent, Nifty PSU Bank index down 2.08 percent. On the other hand, Nifty Pharma index up 1.73 percent.
FII & DII Weekly Activity
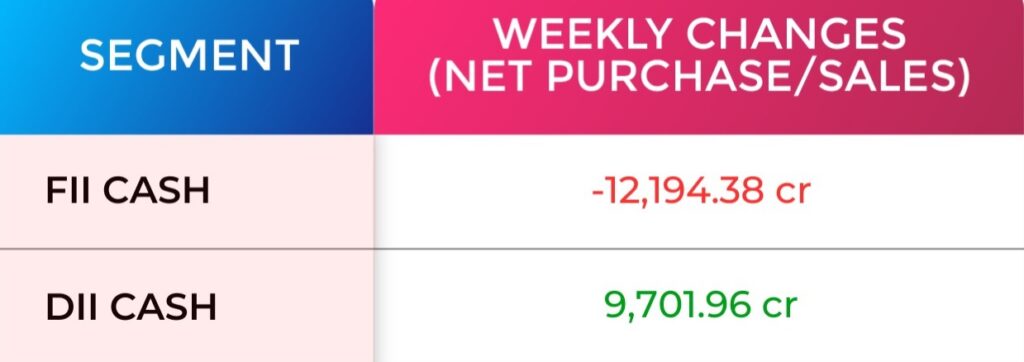
Foreign institutional investors (FIIs) turned net sellers this week, as they sold equities worth Rs.851.16 crore, while Domestic institutional investors (DIIs) bought equities worth Rs 3,467.93 crore.
Global Market
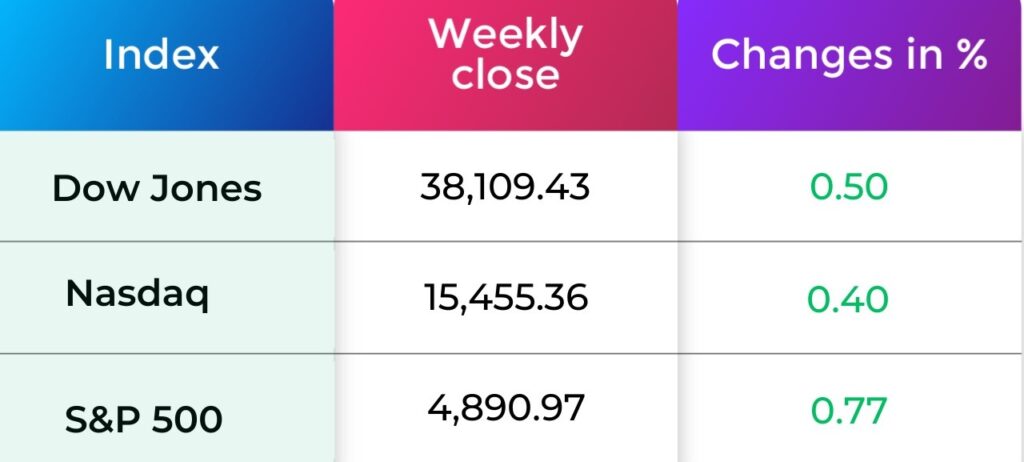
The S&P 500 ended a five-session streak of record highs on Friday, with Intel, opens new tab slumping after a bleak revenue forecast, while U.S. economic data showed inflation moderating. Even as the S&P 500 and Nasdaq ended the session lower, all three major indexes recorded their third straight weekly gain and their 12th weekly advance out of 13. A U.S. Commerce Department report showed the personal consumption expenditure index – the Federal Reserve’s preferred inflation gauge – rose moderately in December.

Currency Indices
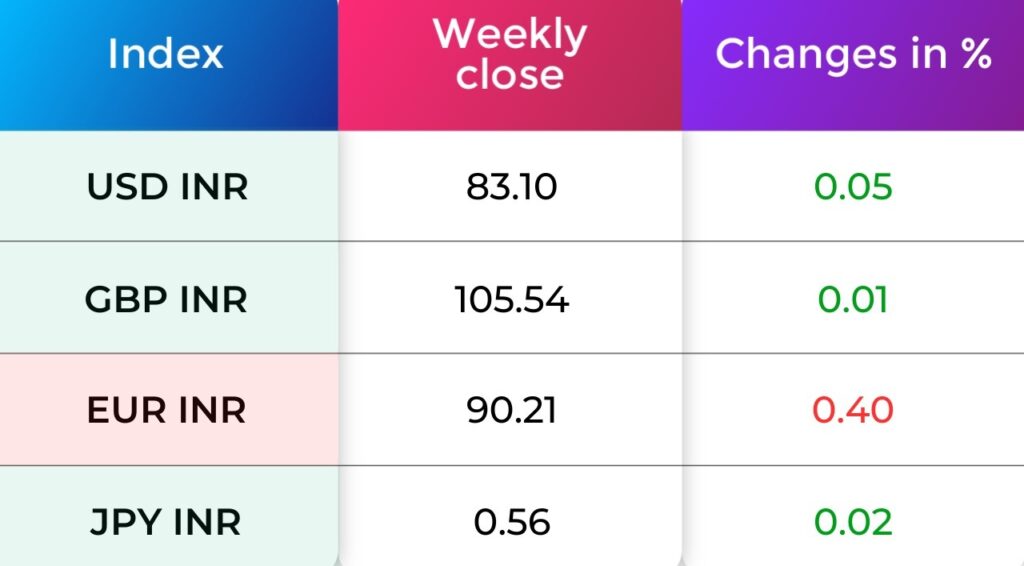
This week, the Indian rupee ended marginally lower against the US dollar. The domestic currency shed 5 paise to end at 83.10 in the week ended January 25 against the January 19 closing of 83.06.
Poll of the week
Last week’s poll:
Q) Stock Trading is involves
a) Capital Risk
b) Guaranteed Return
c) Limited Risk
Last week’s poll answer: c) Limited Risk
Commodity Market
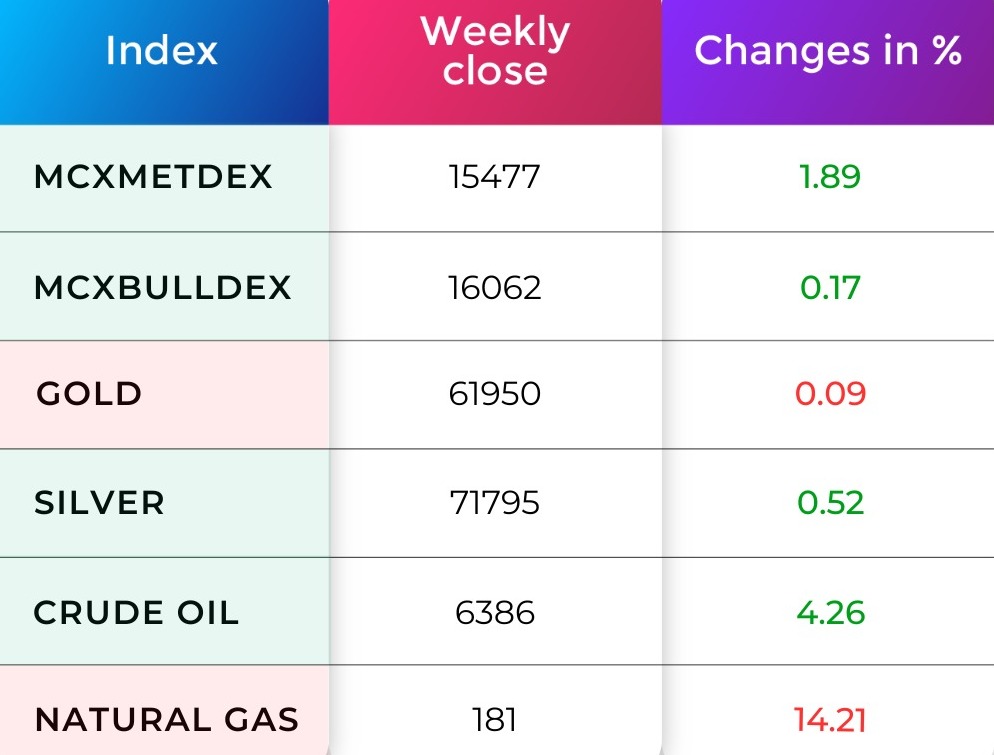
After a strong two-day downfall, natural gas is showing an uptrend movement. This shift is attributed to forecasts predicting cooler weather and higher heating demand over the next two weeks, surpassing previous expectations. Additionally, the slow recovery in output, as a consequence of wells and other equipment freezing during last week’s arctic freeze, is contributing to the ongoing conditions. The current resistance level (R1) is placed at 239.80, while the support level (S1) is positioned at 200.70.
Gold closed 0.09% Negative. Investors are currently waiting for U.S. economic data that could provide more insights into the Federal Reserve’s potential interest rate cuts, potentially impacting the future price movements of gold. The current resistance level (R1) is positioned at 62,198, while the support level (S1) is placed at 61,696.
Did you Know?
The Myth of the October Effect!
There was a phenomenon called the October Effect that many people believed in. The concept was that the month was the worst of all for investors. Typically, investors would point out that the major price declines in 1987 as well as 1929 both occurred in October. However, that pessimistic view has turned out to be incorrect, as statistics show that the month is not the worst of all. But October does lead the pack in one scary category, and that’s volatility. It remains the year’s most roller coaster month for securities prices.
What about September? It is the current record holder for falling prices as for the past 73 years, the average drop in the value of the major exchanges in September is between .5 percent and .8 percent, but there are a few valid reasons for that kind of activity. Many active traders take vacations in late summer and sell off some of their stagnant holdings in the ninth month of the year. Additionally, there is a widespread belief that investors who enjoy annual gains on their portfolios tend to cash out sometime toward the end of the summer season.
Happy investing!
Refer your Friends & Family and GET 500 N Coins.
Use N Coins to Redeem all Charges. #Trade4Free.
Do you have a question? Ask here and we’ll publish the information in the coming weeks.

Do You Find This Interesting?

Happy Learning,
Team Navia