Weekly Wrap-Up (JAN 29 – FEB 02, 2024)

During the unpredictable Budget week, the Indian stock market recorded its most significant weekly increases in two months.
With Nifty reaching a new all-time high. This was influenced by the in-line Interim Budget, the outcome of the FOMC meeting, positive global indicators, and the Q3 earnings reports from Indian companies.
Indices Weekly Performance
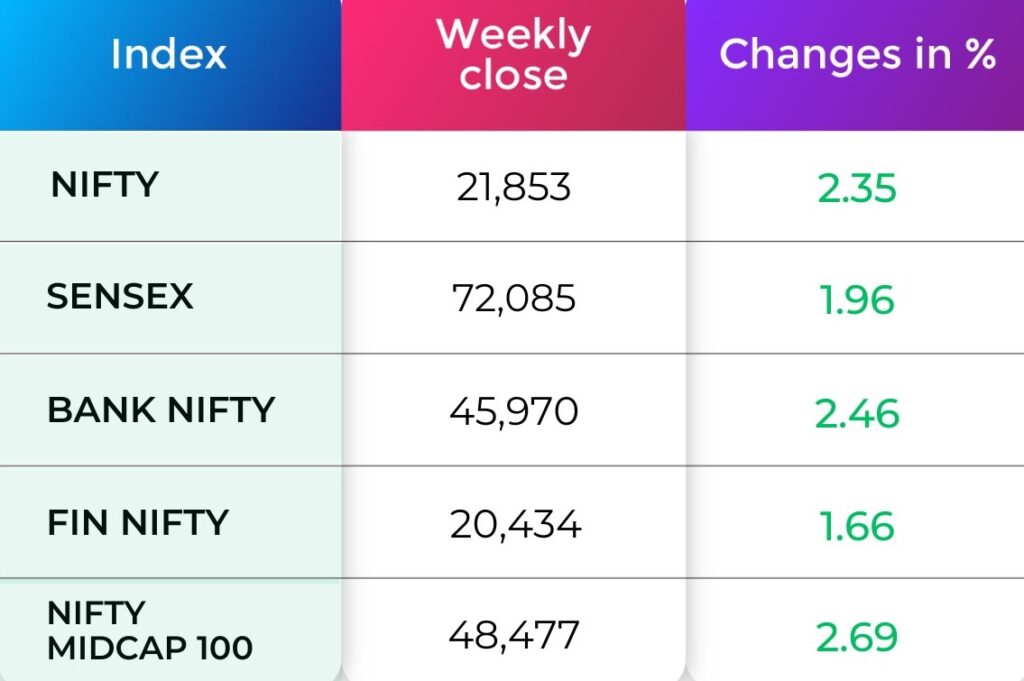
For the week, Nifty gained 2.35 percent to finish at 21,853. while BSE Sensex added 1.96 percent to close at 72,085.
For any further queries, you can now contact us on WhatsApp!
Indices Analysis
✅ NIFTY 50
For the week, the index gained 2.35 percent and formed a long bullish candlestick pattern with an upper shadow that resembled a Double Top formation, which is a bearish reversal pattern. For the index to move up, it has to go past 22,150, the key hurdle on the higher side. Below it, the index may consolidate with support at 21,600-21,500. A break of the support can take the index to 21,300 again, “Confirmation of a bullish trend resumption would only occur with a decisive breakout above the Double Top, which is currently identified around 22,125. Conversely, a break below the support level at 21,500 could indicate a bearish momentum,”
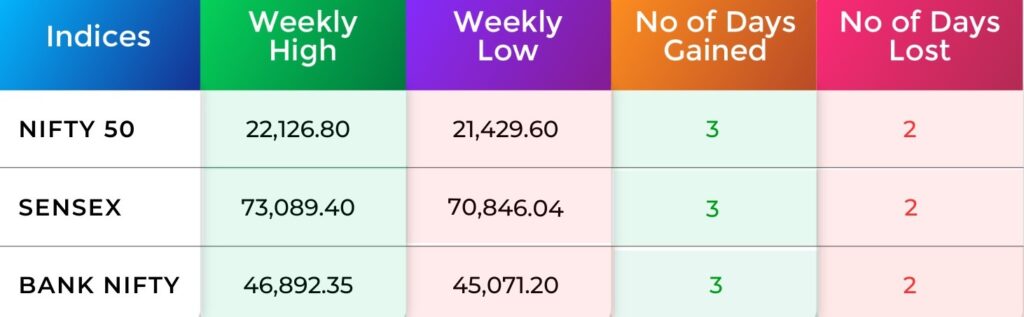
✅ Bank Nifty
The Bank Nifty also opened higher and climbed to 46,892 but failed to hold the gains due to profit-taking. They closed 218 points down at 45,971 and formed a bearish candlestick on the daily chart.For the week, it gained 2.5 percent and formed a bullish candlestick with an upper shadow. The level of 47,000 is expected to be the next hurdle.”Bank Nifty witnessed selling pressure from the 46,900 – 47,000 zone which coincided with the 61.82 percent Fibonacci retracement level of the entire fall it has witnessed from 48,636 – 44,429,”
Nifty Chart
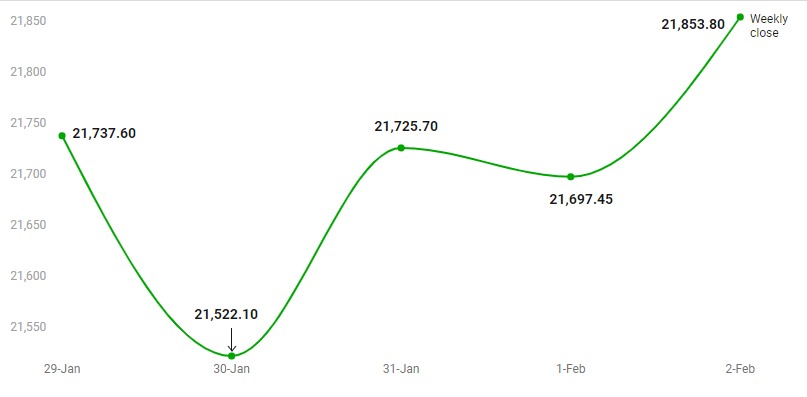
The daily and hourly momentum indicator provide a divergent signal and prices are stuck within a range. Bollinger bands are contracting indicating range-bound price action. Thus, parameters suggest that the consolidation is likely to continue. Stock-specific action and sector rotation is likely to continue during this period of consolidation. Key support levels are 21660 – 21600 while the immediate hurdle zone is placed at 22100 – 22150.
Now with N Coins, Navia customers can actually #Trade4Free.
INDIA VIX
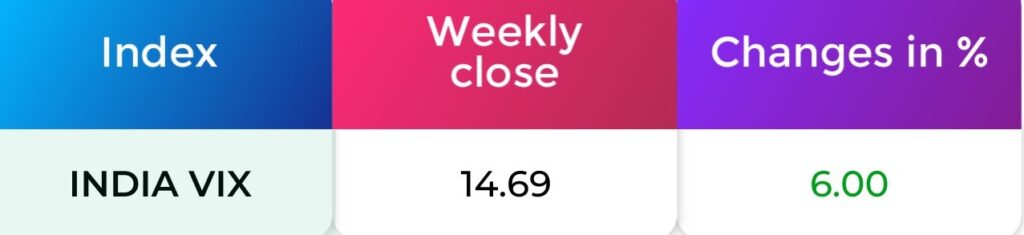
Market volatility increased as INDIA VIX rose by 6.00%, closing at 14.69.
Refer your Friends and family and GET 500 N Coins.
Use N Coins to Redeem all Charges. #Trade4Free.
Sectoral Performance
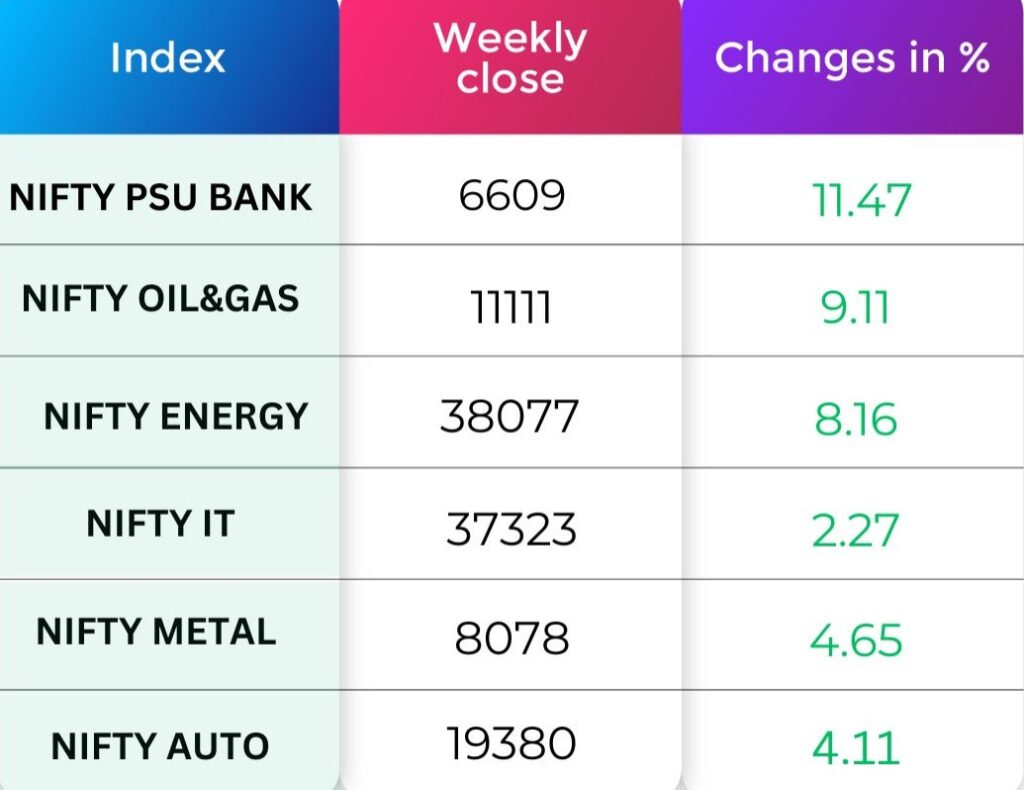
On the sectoral front, Nifty PSU Bank index surged 11.47 percent, Nifty Oil & gas index rose 9.11 percent, Nifty Energy index gained 8.16 percent and Nifty Metal rose 4.65 percent and Auto rose 4.11 percent.
FII & DII Weekly Activity
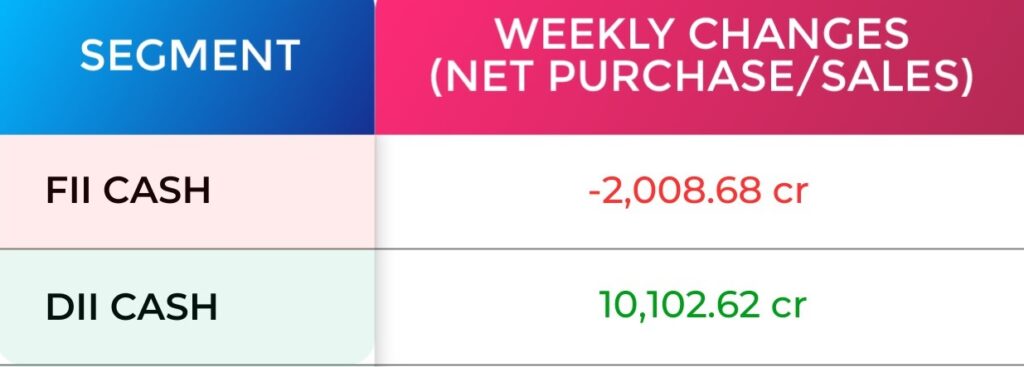
Domestic institutional investors (DIIs) continued their support to the market as they bought equities worth Rs 10,102.62 crore during the week. On the other hand, Foreign institutional investors (FIIs) also shrink their selling as they sold equities only worth of Rs 2,008.68 crore. In the month of January, the FIIs sold equities worth Rs 35,977.87 crore and DIIs bought equities worth Rs 26,743.63 crore.
Global Market
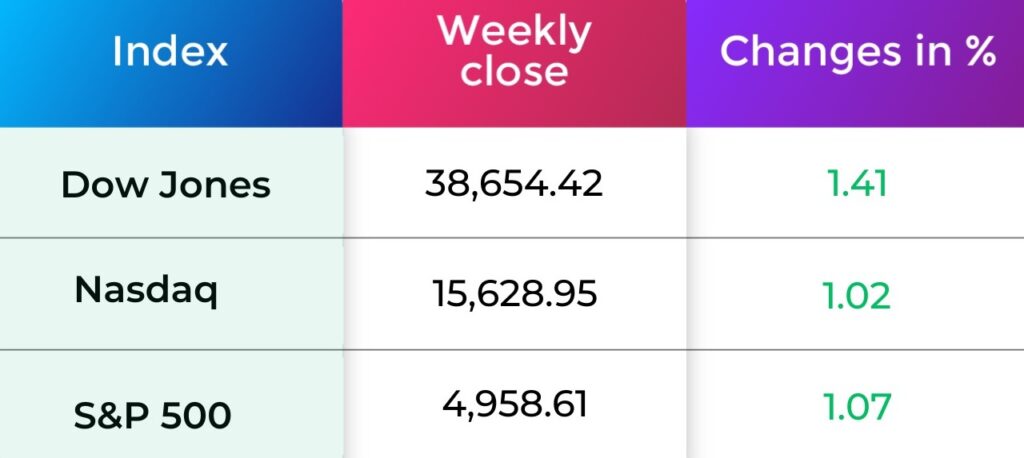
US stocks ended sharply higher on Friday and the S&P 500 registered an all-time closing high as strong earnings and a blowout January employment report boosted confidence in the economy, even while lowering the likelihood that the Federal Reserve will cut interest rates any time soon.
The S&P 500 climbed 1.07% to end the session at 4,958.61 points. The Nasdaq gained 1.02% to 15,628.95 points, while Dow Jones Industrial Average rose 1.41% to 38,654.42 points.

Currency Indices
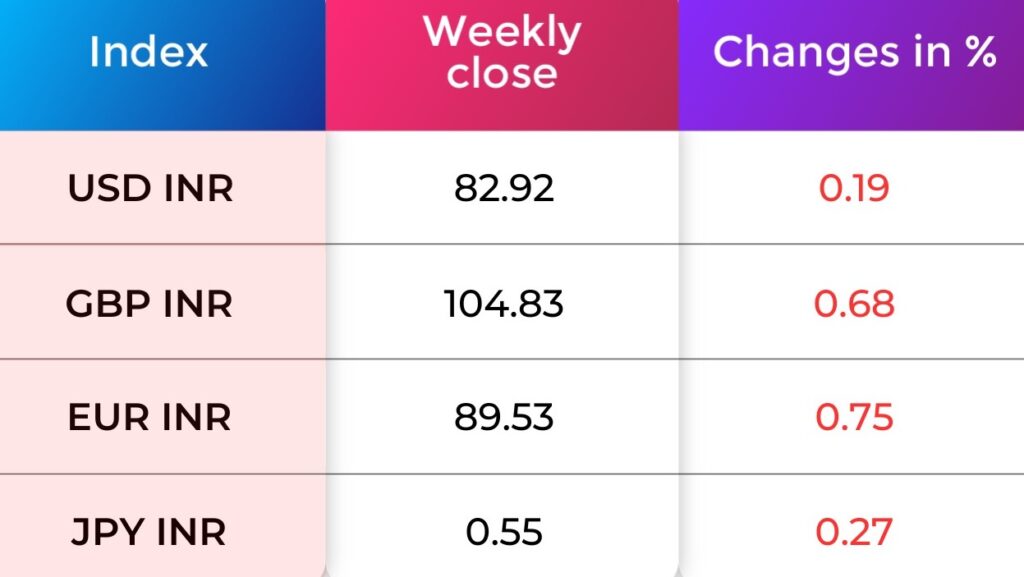
In this week, the Indian rupee gained against the US dollar. The domestic unit added 19 paise to end at 82.92 in the week ended February 2 against the January 25 closing of 83.11.
Poll of the week
Last week’s poll:
Q) Dividends received from limited companies are:
a) Taxable
b) Non Taxable
Last week’s poll answer: a) Taxable
Commodity Market
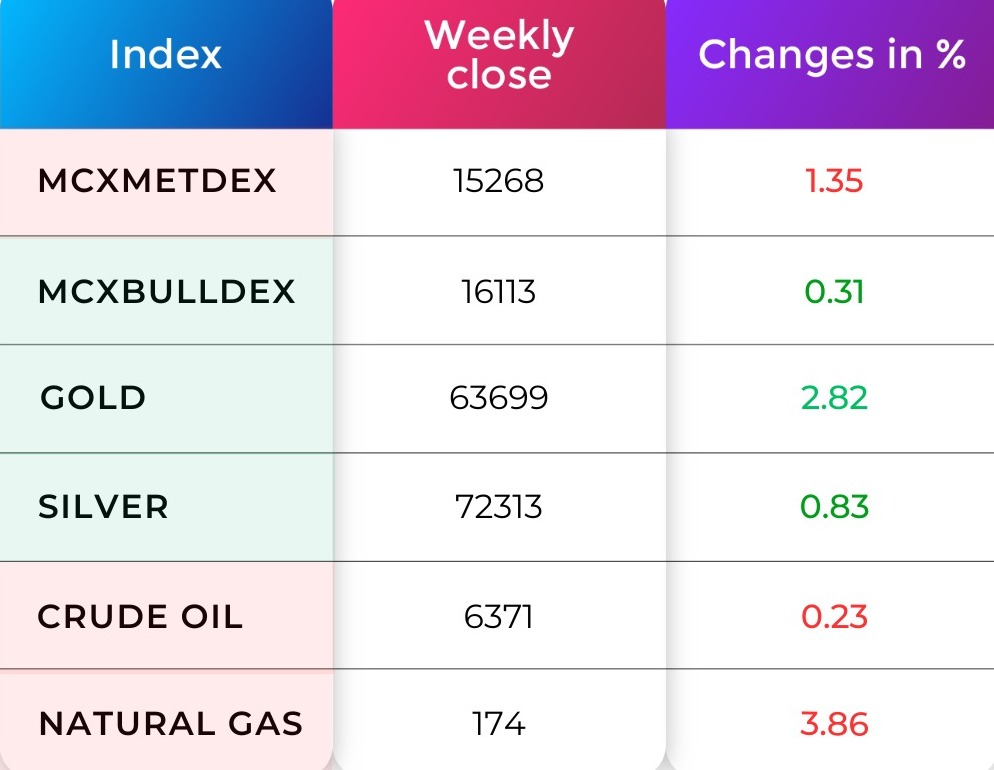
Over the past three trading sessions, crude oil has been showing a downtrend movement. crude oil closed at -0.23%, with defusing tensions in the Middle East easing supply-disruption worries, but still exerting a drag on crude oil prices. The current R1 is placed at 6303, and S1 is placed at 6060.
Natural gas is continuing its downtrend movements, closing -3.86% negative. Heating demand is expected to stay low amid warmer weather forecasted through mid-February. The current R1 is placed at 177, and S1 is placed at 168.50.
Blogs Of The Week

Did you Know?
Wall Street’s Closing Bell Tradition!
Did you know that the New York Stock Exchange (NYSE) boasts a captivating tradition known as the “Closing Bell”? Dating back to the early 1900s, this practice holds historical significance as it originally involved the manual ringing of a brass bell to signify the end of the trading day.
Though it has evolved into a more symbolic gesture over time, the Closing Bell remains an integral part of Wall Street culture. Today, it has transformed into a ceremonial event, with company executives, celebrities, and notable figures often receiving the honor of ringing the bell to officially mark the close of the trading session.
This tradition serves as a bridge between the financial world and the general public. The act, though largely symbolic, is televised, allowing viewers to witness this iconic moment. The Closing Bell has thus become a powerful symbol of the dynamic and interconnected nature of financial markets, adding a touch of glamour and ceremony to the otherwise complex world of stock trading.
Happy Investing!
Refer your Friends & Family and GET 500 N Coins.
Use N Coins to Redeem all Charges. #Trade4Free.
Do you have a question? Ask here and we’ll publish the information in the coming weeks.

Do You Find This Interesting?

Happy Learning,
Team Navia